SP500 LDN TRADING UPDATE 21/10/25

SP500 LDN TRADING UPDATE 21/10/25
WEEKLY & DAILY LEVELS
***QUOTING ES1! FOR CASH US500 EQUIVALENT LEVELS, SUBTRACT POINT DIFFERENCE***
WEEKLY BULL BEAR ZONE 6685/75
WEEKLY RANGE RES 6838 SUP 6566
OCT EOM STRADDLE 6602/6891
NOV MOPEX 6891/6399
DEC QOPEX 6303/7025
DAILY ONE TIME FRAMING HIGHER 6733
WEEKLY MARKET BALANCE - 6591/6809
MONTHLY ONE TIME FRAMING HIGHER 6371
DAILY BULL BEAR ZONE 6635/45
DAILY RANGE RES 6838 SUP 6722
2 SIGMA RES 6894 SUP 6666
VIX DAILY BULL BEAR ZONE 23.5
TRADES & TARGETS
LONG ON TEST/REJECT DAILY BULL BEAR ZONE TARGET DAILY/WEEKLY RANGE RES
SHORT ON TEST/REJECT DAILY/WEEKLY RANGE RES TARGET DAILY BULL BEAR ZONE
(I FADE TESTS OF 2 SIGMA LEVELS ESPECIALLY INTO THE FINAL HOUR OF THE NY CASH SESSION AS 90% OF THE TIME WHEN TESTED THE MARKET WILL CLOSE AT OR BELOW THESE LEVELS)
GOLDMAN SACHS TRADING DESK VIEWS
U.S. EQUITIES COLOR: RISK SENTIMENT TURNS NEGATIVE
The market has been influenced by de-grossing and tariff-related concerns, but there’s reassurance in the current positioning. Panic indicators are elevated but not widespread, and the medium-term growth outlook through 2026 remains constructive, supported by policy measures, balance sheet resilience, and continued AI-driven investments.
Earnings season has started strongly, with approximately 12% of S&P companies reporting so far; 74% have exceeded consensus EPS by more than 1 standard deviation, compared to a long-term average of 46%. Next week, another 14% of companies are set to report, spanning AI-focused names (DLR, GEV, TSLA, IBM), consumer-oriented firms (COF, NFLX, T, TMUS, KO, LUV, PG, HCA), industrials (F, HON, LMT, NOC), and refiners (VLO). This quarter’s emphasis appears to be less on earnings growth itself and more on cash-spending priorities—how companies allocate incremental dollars toward AI capital expenditure, research and development, and shareholder returns like buybacks and dividends.
Banks have delivered mixed results. Major money-center institutions such as JPM, WFC, BAC, C, and MS posted solid Q3 outcomes, while regional banks drew attention, particularly ZION, which disclosed a $50 million charge-off linked to misrepresented loans in its NDFI portfolio (loans to mortgage originators and private credit firms). Recent bankruptcies (First Brands, Tricolor, and Cantor Group) have raised concerns, but GS Research considers these issues idiosyncratic rather than systemic—fraud-related anomalies rather than broader credit cracks. However, further portfolio reviews could uncover additional cases, making a shift toward higher-quality banks prudent. Notably, KRE ETF redemptions reached $570 million on Thursday, marking the largest single-day outflow since 2021, surpassing any day during the 2023 regional banking stress and highlighting heightened sensitivity.
Global equity flows last week were heavily skewed toward selling, marking the largest net outflows in over six months (since April). In the U.S., hedge funds engaged in the fastest pace of equity net selling since April, primarily through short activity, while long flows remained muted. Macro products (indices and ETFs) accounted for nearly 80% of total net selling, with U.S.-listed ETF shorts increasing by 6.1%, the largest weekly build in over five months.
Following the most intense de-grossing phase since spring, quality stocks outperformed significantly. The GSP1QUAL index achieved its strongest consecutive gains since the COVID era, while speculative segments like Quantum Computing (GSX1QNTM), Non-Profitable Tech (GSX1NPTC), and Most Short (GSX1MSAL) gave up some of their recent advances. Momentum exposure in the prime brokerage book remains elevated (94th percentile over 5 years, 91st percentile over 1 year), concentrated in six-month outperformers (GSXUHMO6) that led the summer rally but may be vulnerable if de-grossing continues.
On the technical side, trend-following funds remain heavily net long across major equity futures. Over the past week, CTAs have slightly reduced exposure, selling an estimated $2 billion globally. However, 1-month model-implied flows remain modest in either direction (roughly +/- $10–15 billion under +/-2 SD moves). This suggests positioning is stretched, but flow risk is limited unless there’s a significant volatility shock or spot movement. Tactically, downside pressure is muted for now, though incremental buying at current levels from this cohort is unlikely.
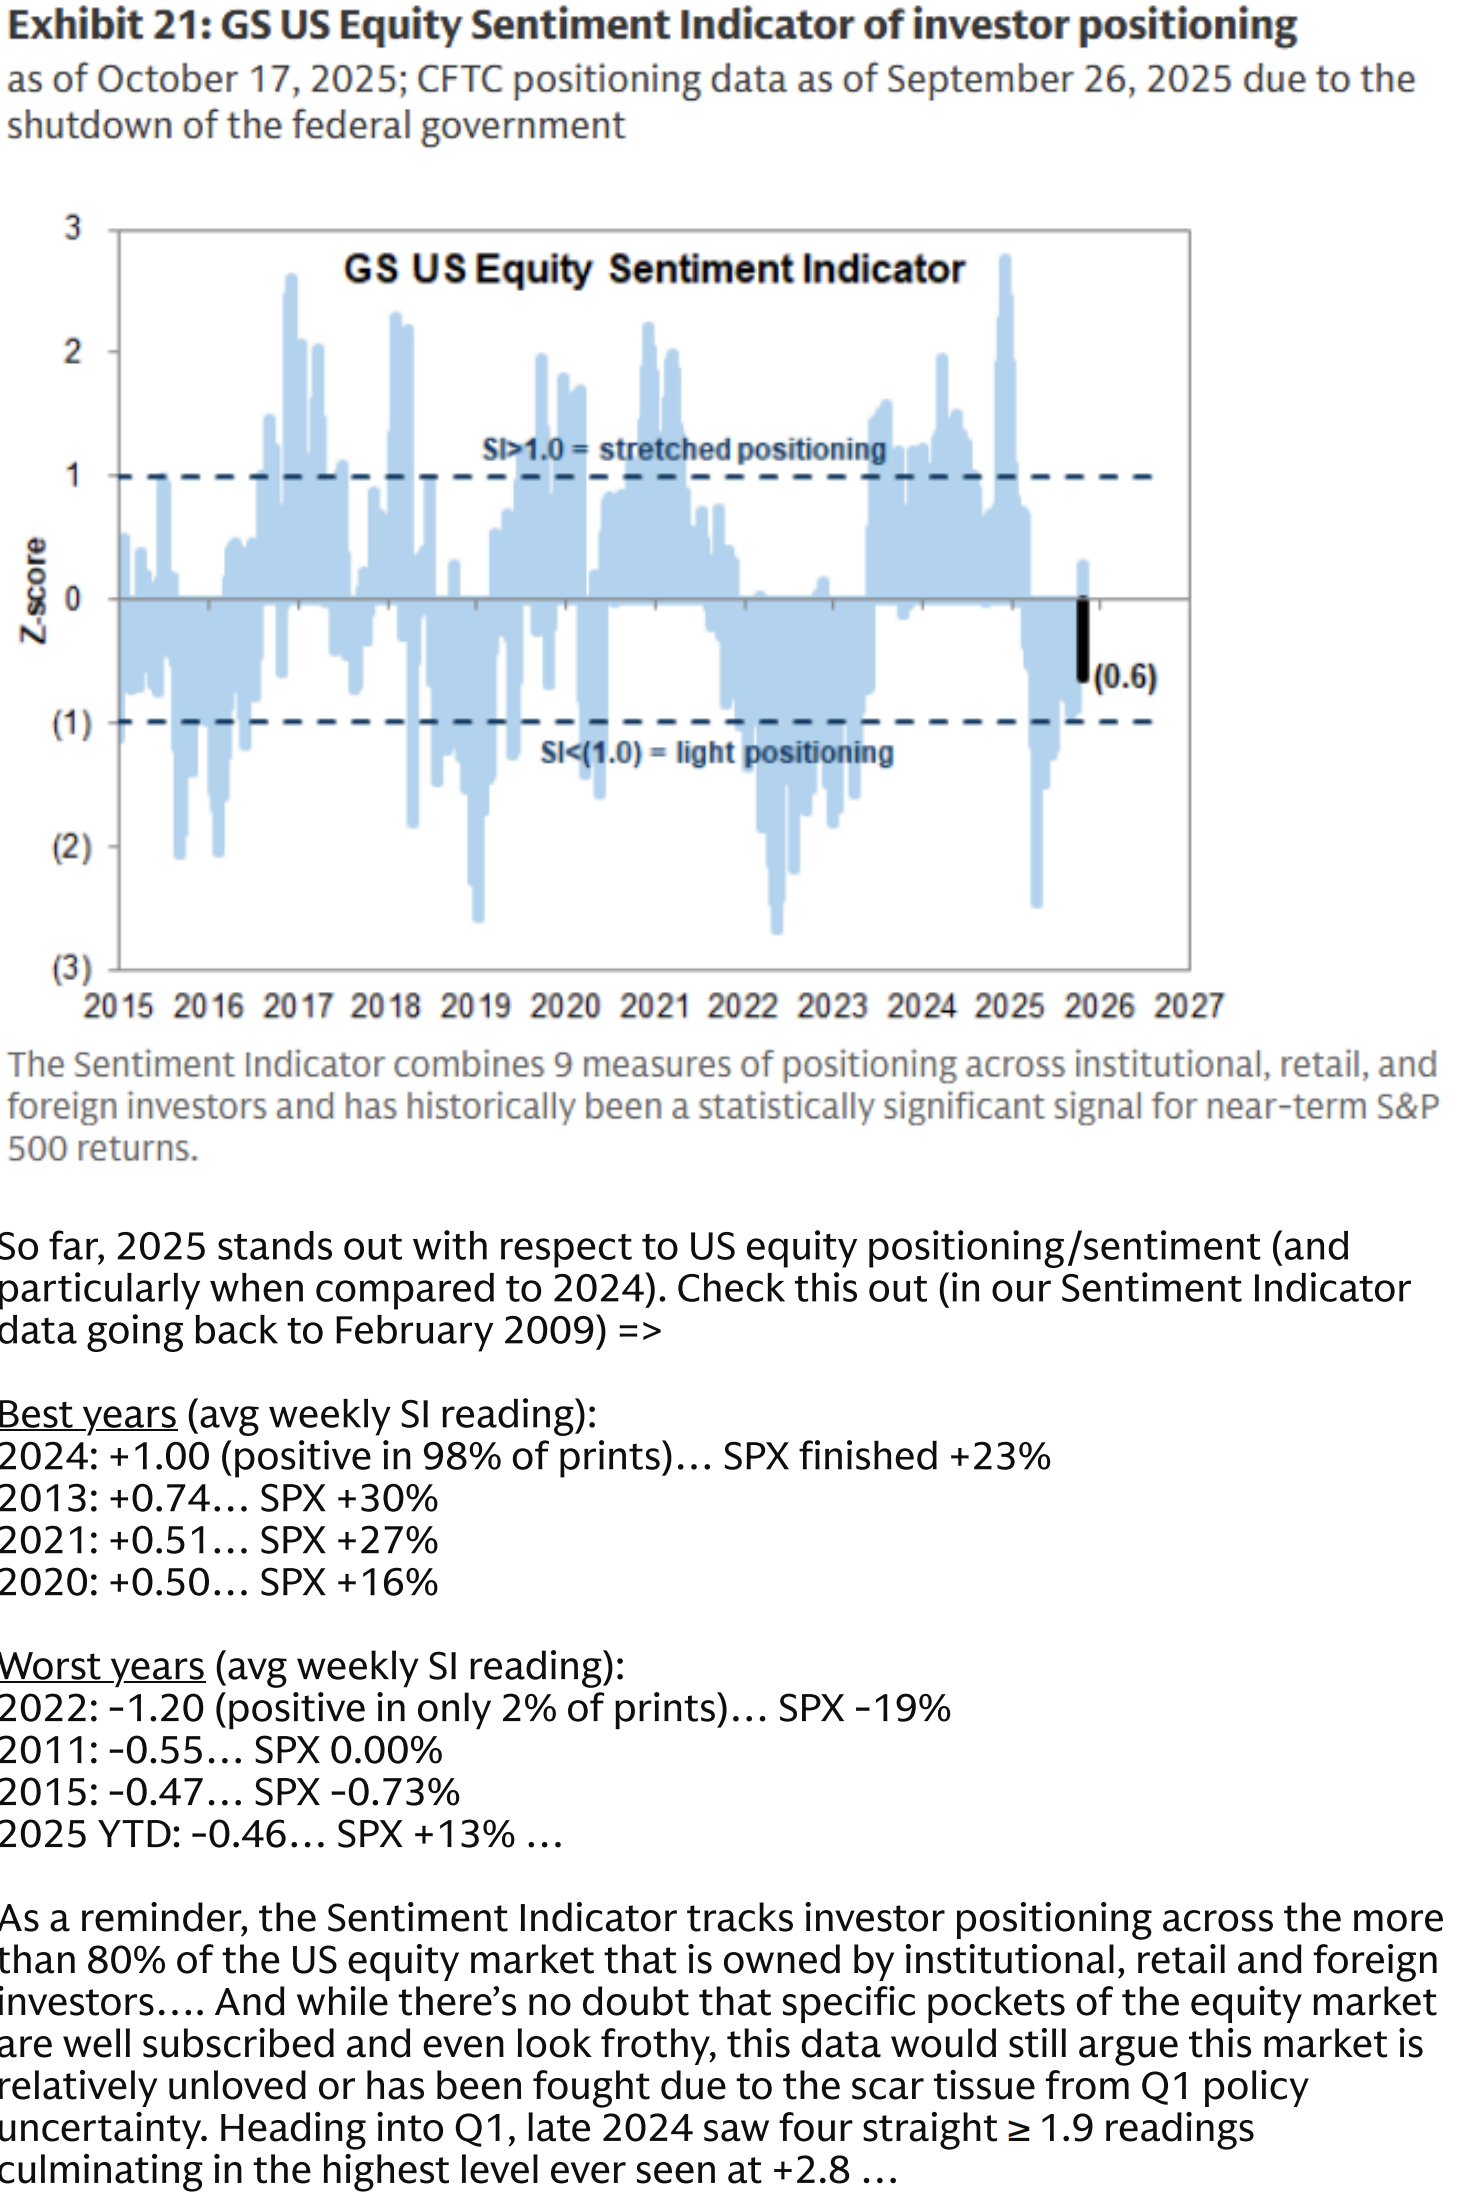
Overall, last week’s activity drove the US Equity Sentiment Indicator into negative territory at -0.6. This shift has been a key discussion point during recent client meetings in the Middle East and Asia
Disclaimer: The material provided is for information purposes only and should not be considered as investment advice. The views, information, or opinions expressed in the text belong solely to the author, and not to the author’s employer, organization, committee or other group or individual or company.
Past performance is not indicative of future results.
High Risk Warning: CFDs are complex instruments and come with a high risk of losing money rapidly due to leverage. 69% and 73% of retail investor accounts lose money when trading CFDs with Tickmill UK Ltd and Tickmill Europe Ltd respectively. You should consider whether you understand how CFDs work and whether you can afford to take the high risk of losing your money.
Futures and Options: Trading futures and options on margin carries a high degree of risk and may result in losses exceeding your initial investment. These products are not suitable for all investors. Ensure you fully understand the risks and take appropriate care to manage your risk.
Patrick has been involved in the financial markets for well over a decade as a self-educated professional trader and money manager. Flitting between the roles of market commentator, analyst and mentor, Patrick has improved the technical skills and psychological stance of literally hundreds of traders – coaching them to become savvy market operators!